
London Housing Market Through the Lens of Time – An Updated Perspective
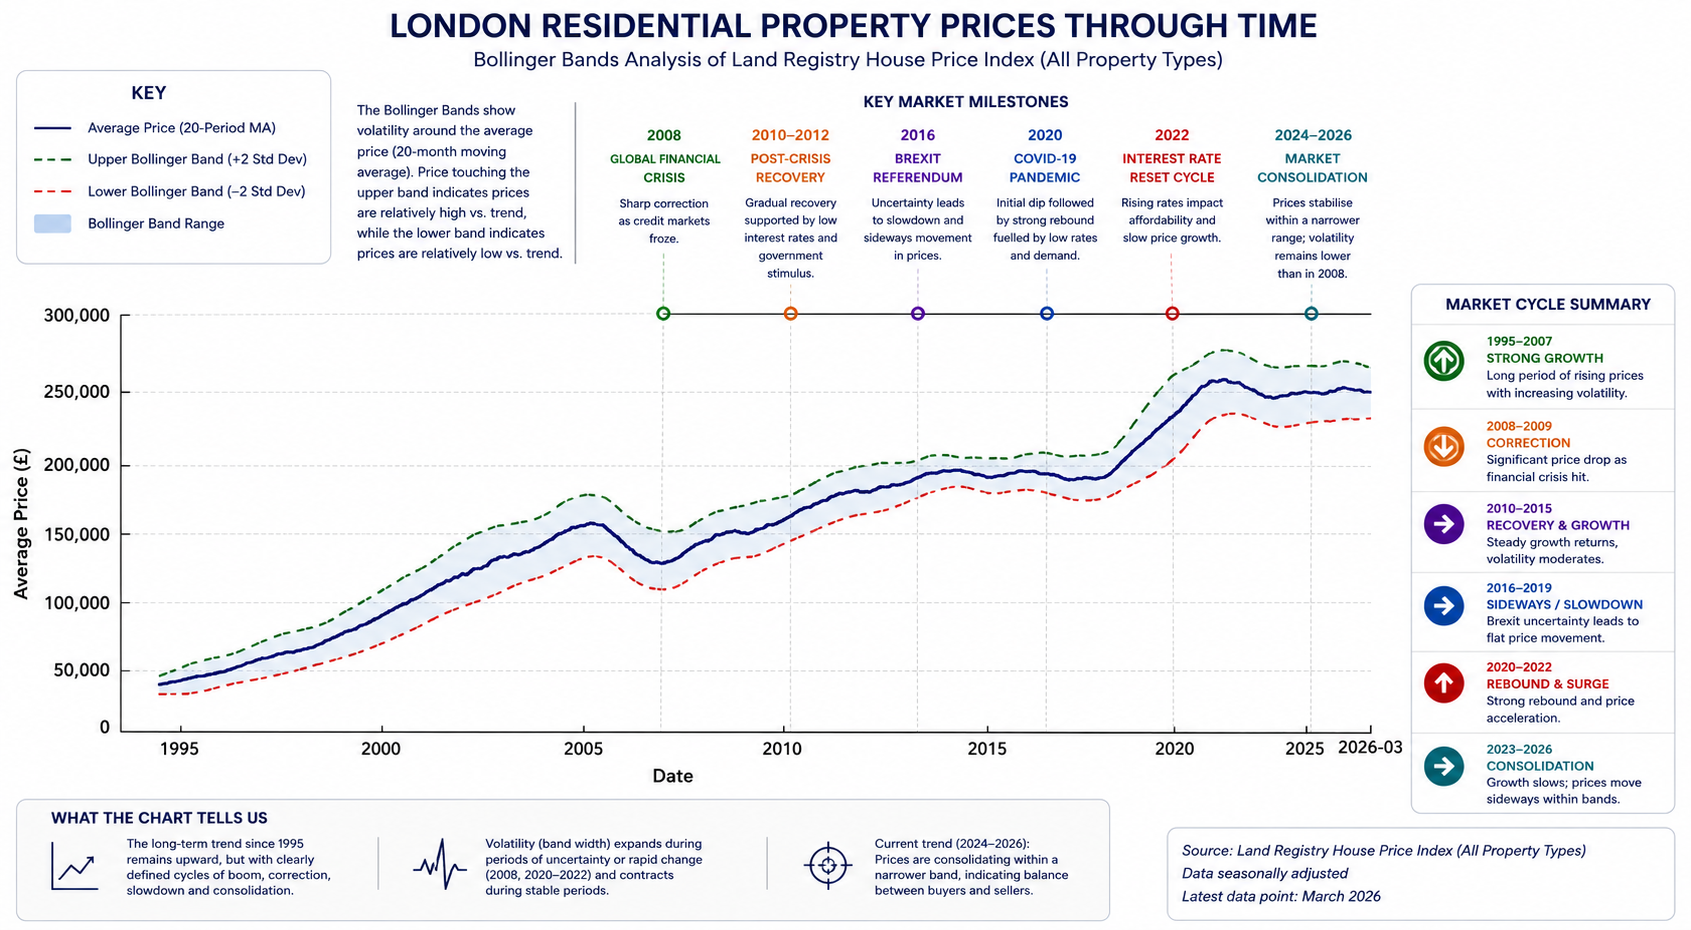
The updated Bollinger Bands chart tells a far more realistic story about the UK housing market than a simple long-term upward line. While the broader trend since the mid-1990s has undoubtedly been upward, the path has never been smooth or predictable. Instead, the market has moved through repeated cycles of acceleration, correction, stagnation, recovery and consolidation.
Before going further, it is worth briefly explaining what Bollinger Bands actually are and why I incorporated them into a property market chart.
Bollinger Bands are a technical analysis tool more commonly used in financial markets. They consist of a moving average surrounded by upper and lower bands that expand during periods of high volatility and contract during quieter market conditions. In simple terms, they help visualise when markets become overheated, compressed, unstable or unusually calm.
While property markets move far more slowly than stocks or cryptocurrencies, the same principle can still reveal something interesting. When the bands widen, it often reflects periods of stronger momentum, policy-driven price surges or heightened uncertainty. When the bands narrow, it usually signals stagnation, consolidation and reduced volatility. Historically, these compressed periods are often followed by larger directional moves later on.
This is important because many commentators either focus entirely on short-term pessimism or blindly assume prices only move in one direction. The reality usually sits somewhere in between.
The chart clearly shows that UK property prices experience long periods where the market effectively moves sideways in real terms. During these phases, prices may fluctuate within a relatively narrow range while volatility compresses. These periods are extremely important because they often precede the next major move, either upward or downward.
One of the clearest examples occurred after the 2008 financial crisis. While prices initially corrected sharply, the UK market then entered a lengthy consolidation and recovery phase between roughly 2010 and 2016. Growth existed, but it was uneven and heavily influenced by ultra-low interest rates, quantitative easing, international capital flows and government-backed lending stimulus.
The Brexit period between approximately 2016 and 2019 created another extended stagnation phase, particularly across London and parts of the higher-value market. Transaction volumes weakened, confidence softened, and price growth flattened considerably. However, rather than collapsing outright, the market largely absorbed uncertainty through time rather than through a dramatic crash.
The pandemic then produced another major policy-driven distortion. Extremely low interest rates, stamp duty incentives, cheap borrowing and changing lifestyle preferences triggered a rapid surge in prices between 2020 and 2022. The chart reflects this clearly through expanding Bollinger Bands and increased volatility. This was not purely organic growth generated by productivity or wage expansion. Much of it was fuelled by monetary policy and government intervention.
Today, the market appears to be entering another important transition phase.
Since 2022, higher interest rates, affordability pressures, inflation and economic uncertainty have slowed momentum significantly. The bands on the chart are beginning to narrow again, suggesting reduced volatility and a market searching for direction. Across many parts of the UK, and particularly in London and the South East, prices have not collapsed, but they have effectively entered a broad consolidation phase.
This is precisely the type of environment where future policy decisions become critically important.
History shows that government intervention can rapidly alter housing market sentiment. Changes to stamp duty, lending rules, taxation, planning policy or interest rates can quickly shift the market from stagnation into renewed growth or trigger sharper corrections.
For example, Reform UK has discussed reducing or significantly reforming stamp duty, while wider discussions across the political spectrum continue around housing stimulus, planning reform and transaction taxes. If a future government were to introduce meaningful buyer incentives or reduce transaction costs during a period of compressed volatility, the market could react sharply upward.
However, the opposite is equally possible.
Periods of prolonged stagnation can also create fragile market conditions. If economic growth remains weak, unemployment rises, mortgage costs stay elevated and confidence deteriorates further, then long consolidation phases can eventually resolve through downward price correction rather than renewed expansion.
This is where the current market becomes particularly interesting.
The Bollinger Bands suggest the housing market is approaching a decision point rather than continuing along a simple predictable trend. The market is no longer experiencing the rapid growth phase of the post-pandemic period, but neither does it yet display the characteristics of a full-scale collapse. Instead, volatility is compressing, sentiment is mixed, and policy sensitivity has increased dramatically.
Compression itself does not predict direction with certainty. What it suggests is that periods of low volatility rarely persist indefinitely.
Another important signal emerging from the current market is transaction weakness rather than outright price collapse.
Recent Zoopla research found that around 44% of homes listed for sale in the UK over the past three years either failed to sell or were withdrawn from the market. A large proportion of successful sellers also had to reduce their asking prices before securing buyers. This points towards something deeper than temporary sentiment weakness.
Many existing homeowners, particularly younger households attempting to move up the property ladder, are increasingly constrained by affordability. Property values may have risen significantly over previous decades, but wages have not increased at the same pace. Mortgage affordability tests remain strict, deposits remain difficult to accumulate, and higher interest rates have materially reduced borrowing power.
In practical terms, many households simply cannot bridge the gap between the equity they currently hold and the cost of their next property purchase.
The result is reduced mobility across the housing ladder, lower transaction volumes, slower market activity and increasing stagnation.
Historically, property booms relied heavily on expanding credit availability, falling interest rates and government stimulus measures that effectively increased purchasing power. Today, those conditions are far weaker than they were during previous cycles.
That is why the current consolidation phase may be more significant than many realise.
The market is not merely pausing because buyers are temporarily cautious. In many cases, affordability itself has reached structural limits, particularly for younger generations.
Unless wages rise substantially, borrowing conditions ease again, or governments intervene aggressively through tax reductions or housing stimulus, it becomes increasingly difficult to justify another prolonged period of rapid price inflation similar to the post-2010 era.
Ironically, this may eventually become positive news for first-time buyers.
For years, many younger buyers have faced a market where prices moved further away from incomes almost continuously. A prolonged period of stagnation, or even moderate real-term correction when adjusted for inflation, could slowly improve affordability over time.
From a psychological perspective, this is uncomfortable for existing owners and investors who became accustomed to persistent capital growth. But from a broader economic perspective, slower growth or moderate correction may ultimately create healthier long-term market conditions.
Personally, I remain cautious rather than strongly bullish at this stage.
This does not necessarily mean a dramatic collapse is imminent. The UK still suffers from structural housing shortages, planning constraints and long-term supply limitations, particularly in high-demand areas.
But it may mean that the next decade looks very different from the previous one.
Rather than another effortless boom driven by ultra-cheap debt and rapidly expanding credit, the market may instead experience longer periods of stagnation, selective corrections and slower, more uneven growth.
And if that happens, many first-time buyers who were previously locked out of the market may finally begin to see a more realistic path towards ownership again.